ELSTE Data science

Some concept of Python coding and statistical inference

Sébastien Biass

Earth Sciences

Stéphane Guerrier

Earth Sciences

Pharmaceutical Sciences

October 15, 2025

Get ready

Why this class?

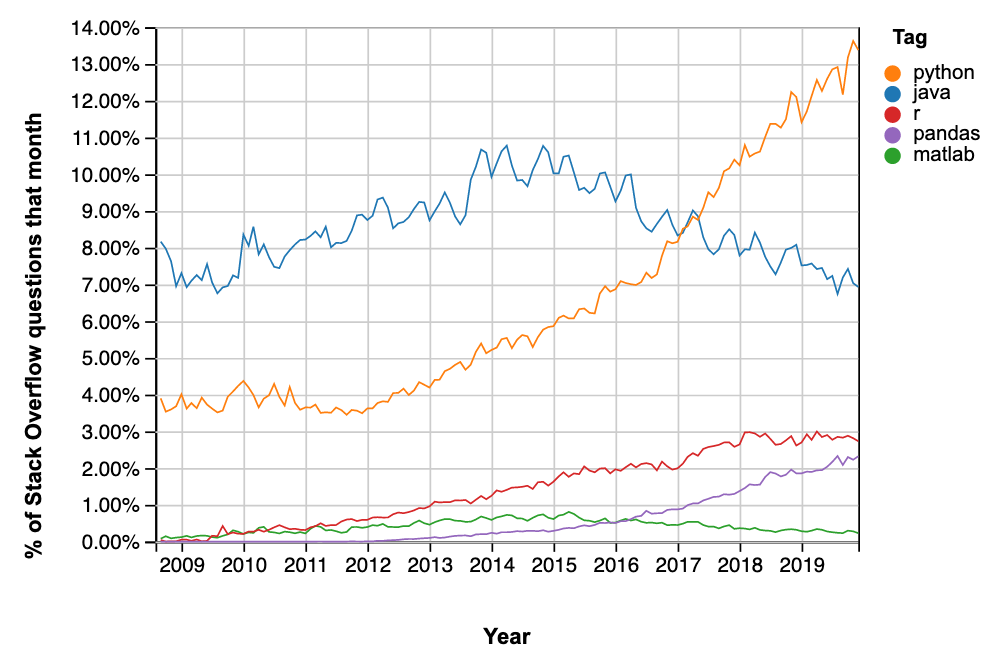
Data deluge: The big EO data landscape
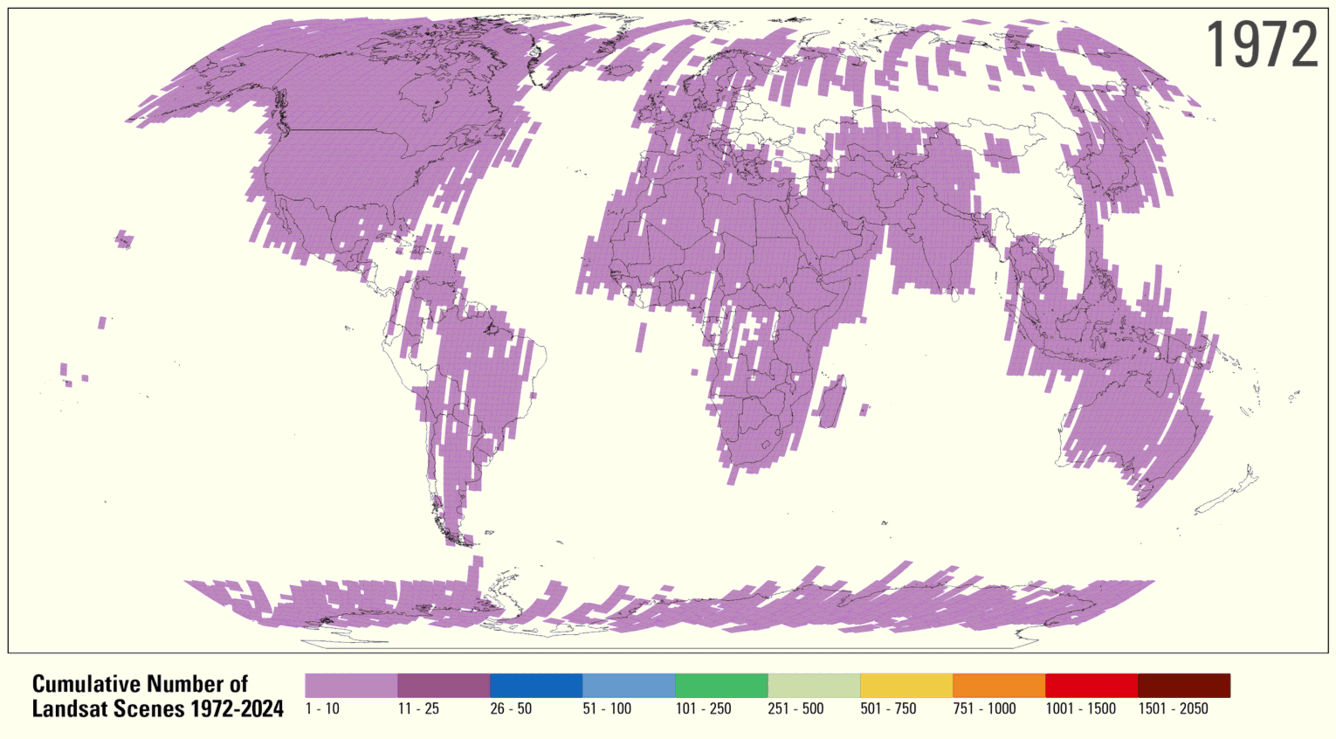
  • Landsat:
    • Download: 53 images/day (2001) - 220’000 images/day (2017)
    • 5 million images of the Earth surface → > 5 PB
  • ESA Sentinel 1 & 24.6TB /daily!

Why this class?

As scientists, we are exposed to:

  • Increasing computational power/facilities
  • Increasing amount of data

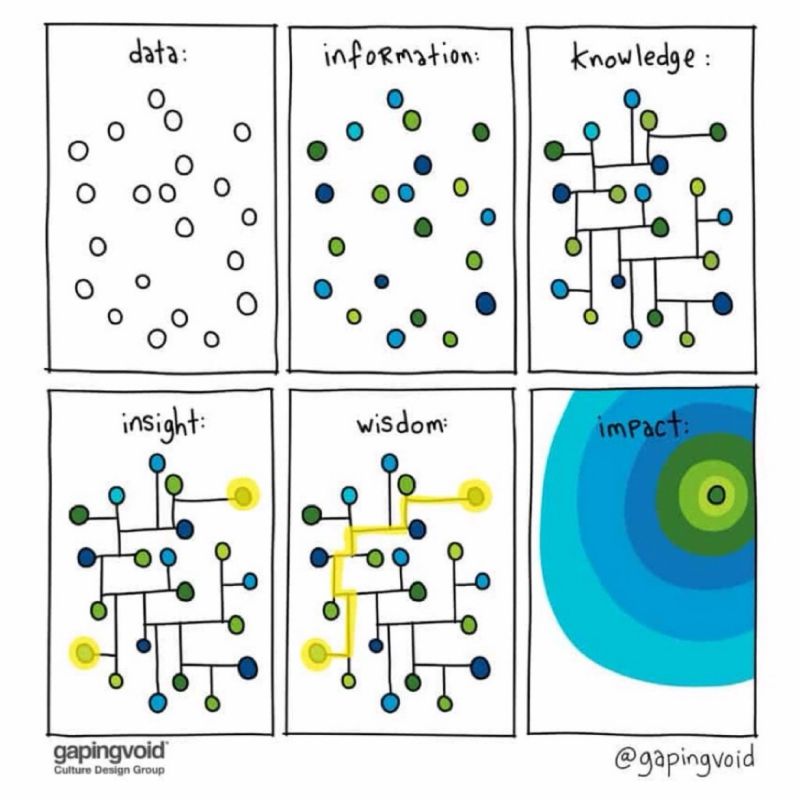
How do we make sense of it all?

  • Scientific coding → gateway to scientific data analysis
  • Data science → extracting meaningful infomation and insights from data

What is data science

Wikipedia

Data science is an interdisciplinary academic field that uses statistics, scientific computing, scientific methods, processing, scientific visualization, algorithms and systems to extract or extrapolate knowledge from […] data.

National Institutes of Standards and Technology

The field that combines domain expertise, programming skills, and knowledge of mathematics and statistics to extract meaningful insights from data.

Class schedule

  • Fall part at UNIGE: 6 \(\times\) 3-h long sessions
  • Assistants: Simon Thivet, Filippo Salmaso, Lionel Voirol
  • Format: Theory, live coding and exercises

October 15 and 22

  • Seb → Intro to data science libraries for PythonPandas, seaborn

October 29 and November 5

  • Stéphane → Intro to statistical method for data inference

November 12 and 19

  • Flexible as a function of how we progress
  • Exam format to be defined

Class objectives

  • Scientific coding and stats often appear daunting
  • True, there can be a steep learning curve

Objectives

  • Not to make you and expert developer / statistician but
    • To help you gain the confidence that you are totally capable of doing it
    • To make you realise that what you will get in terms of research capabilities is worth the effort!

Get involved!!!

We want this class to be useful for your research!

Try to contextualise the course material to your research:

  • Do you already have your own datasets you could bring to class?
  • Can you use the course to formulate new research questions?
  • Do you know any open-access datasets relevant to your fields?
    • If not, can you find some for the next weeks?

Why coding?

Motivations

  • Example: A common - but unnecessarily complicated - workflow of many specialised softwares

%%{init: {"theme":"dark"}}%%
flowchart LR
    B[Data Collection]
    B --> C[Data Cleaning]
    C --> D[Analysis]
    D --> E[Visualisation]

  • Objective: Integrate full research workflow in an environment supporting all tasks

flowchart LR
    B[Start]
    B --> C["<img src='https://s3.dualstack.us-east-2.amazonaws.com/pythondotorg-assets/media/community/logos/python-logo-only.png' width='20'>"]
    C --> D[End]

Motivations

Motivation 1: Automation
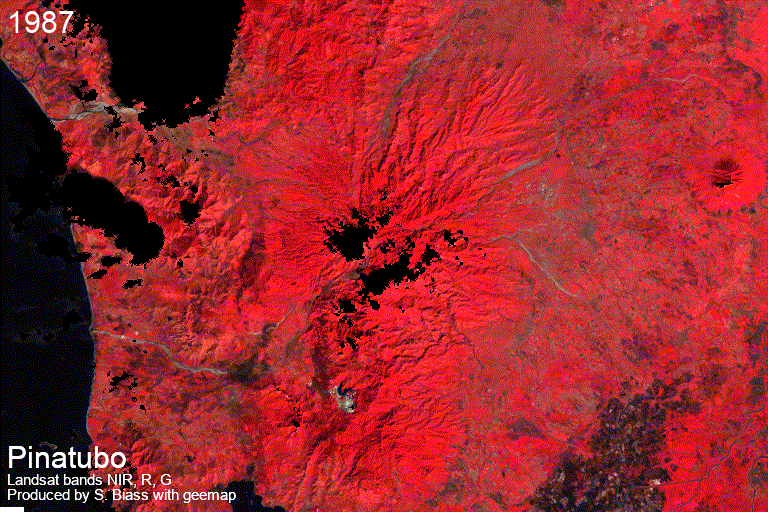
Cotopaxi volcano

  • Reconstructing eruption source parameters (ESP) from tephra deposits
    • How do different measurement methods influence ESP estimates?
  • 40 outcrops
  • ~10 samples per outcrop
  • ~7 measurement methods per sample

Motivations

Motivation 2: Data analysis

Example 1: Exploit catalogues of big Earth Observation data

  • Revisit big EO catalogues to infer new knowledge
    • What controls the impact and recovery of vegetation following eruptions?

Motivations

Motivation 2: Data analysis

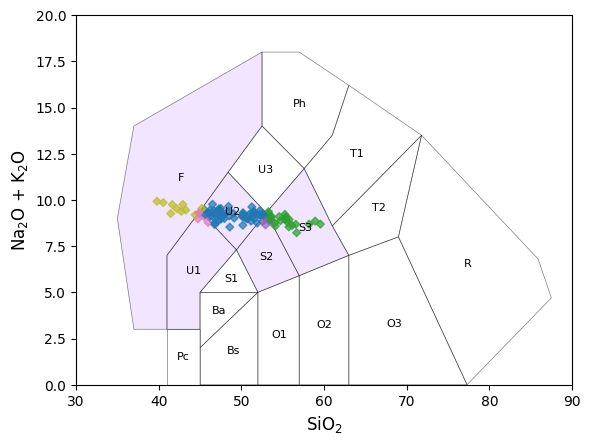
Example 2: Streamline global geochemical analyses

  • Access global databases
    • e.g., Georock database
  • Automatic dedicated analyses/plots
    • e.g., TAS diagrams and classification using pyrolite

Motivations

Motivation 3: Visualisation

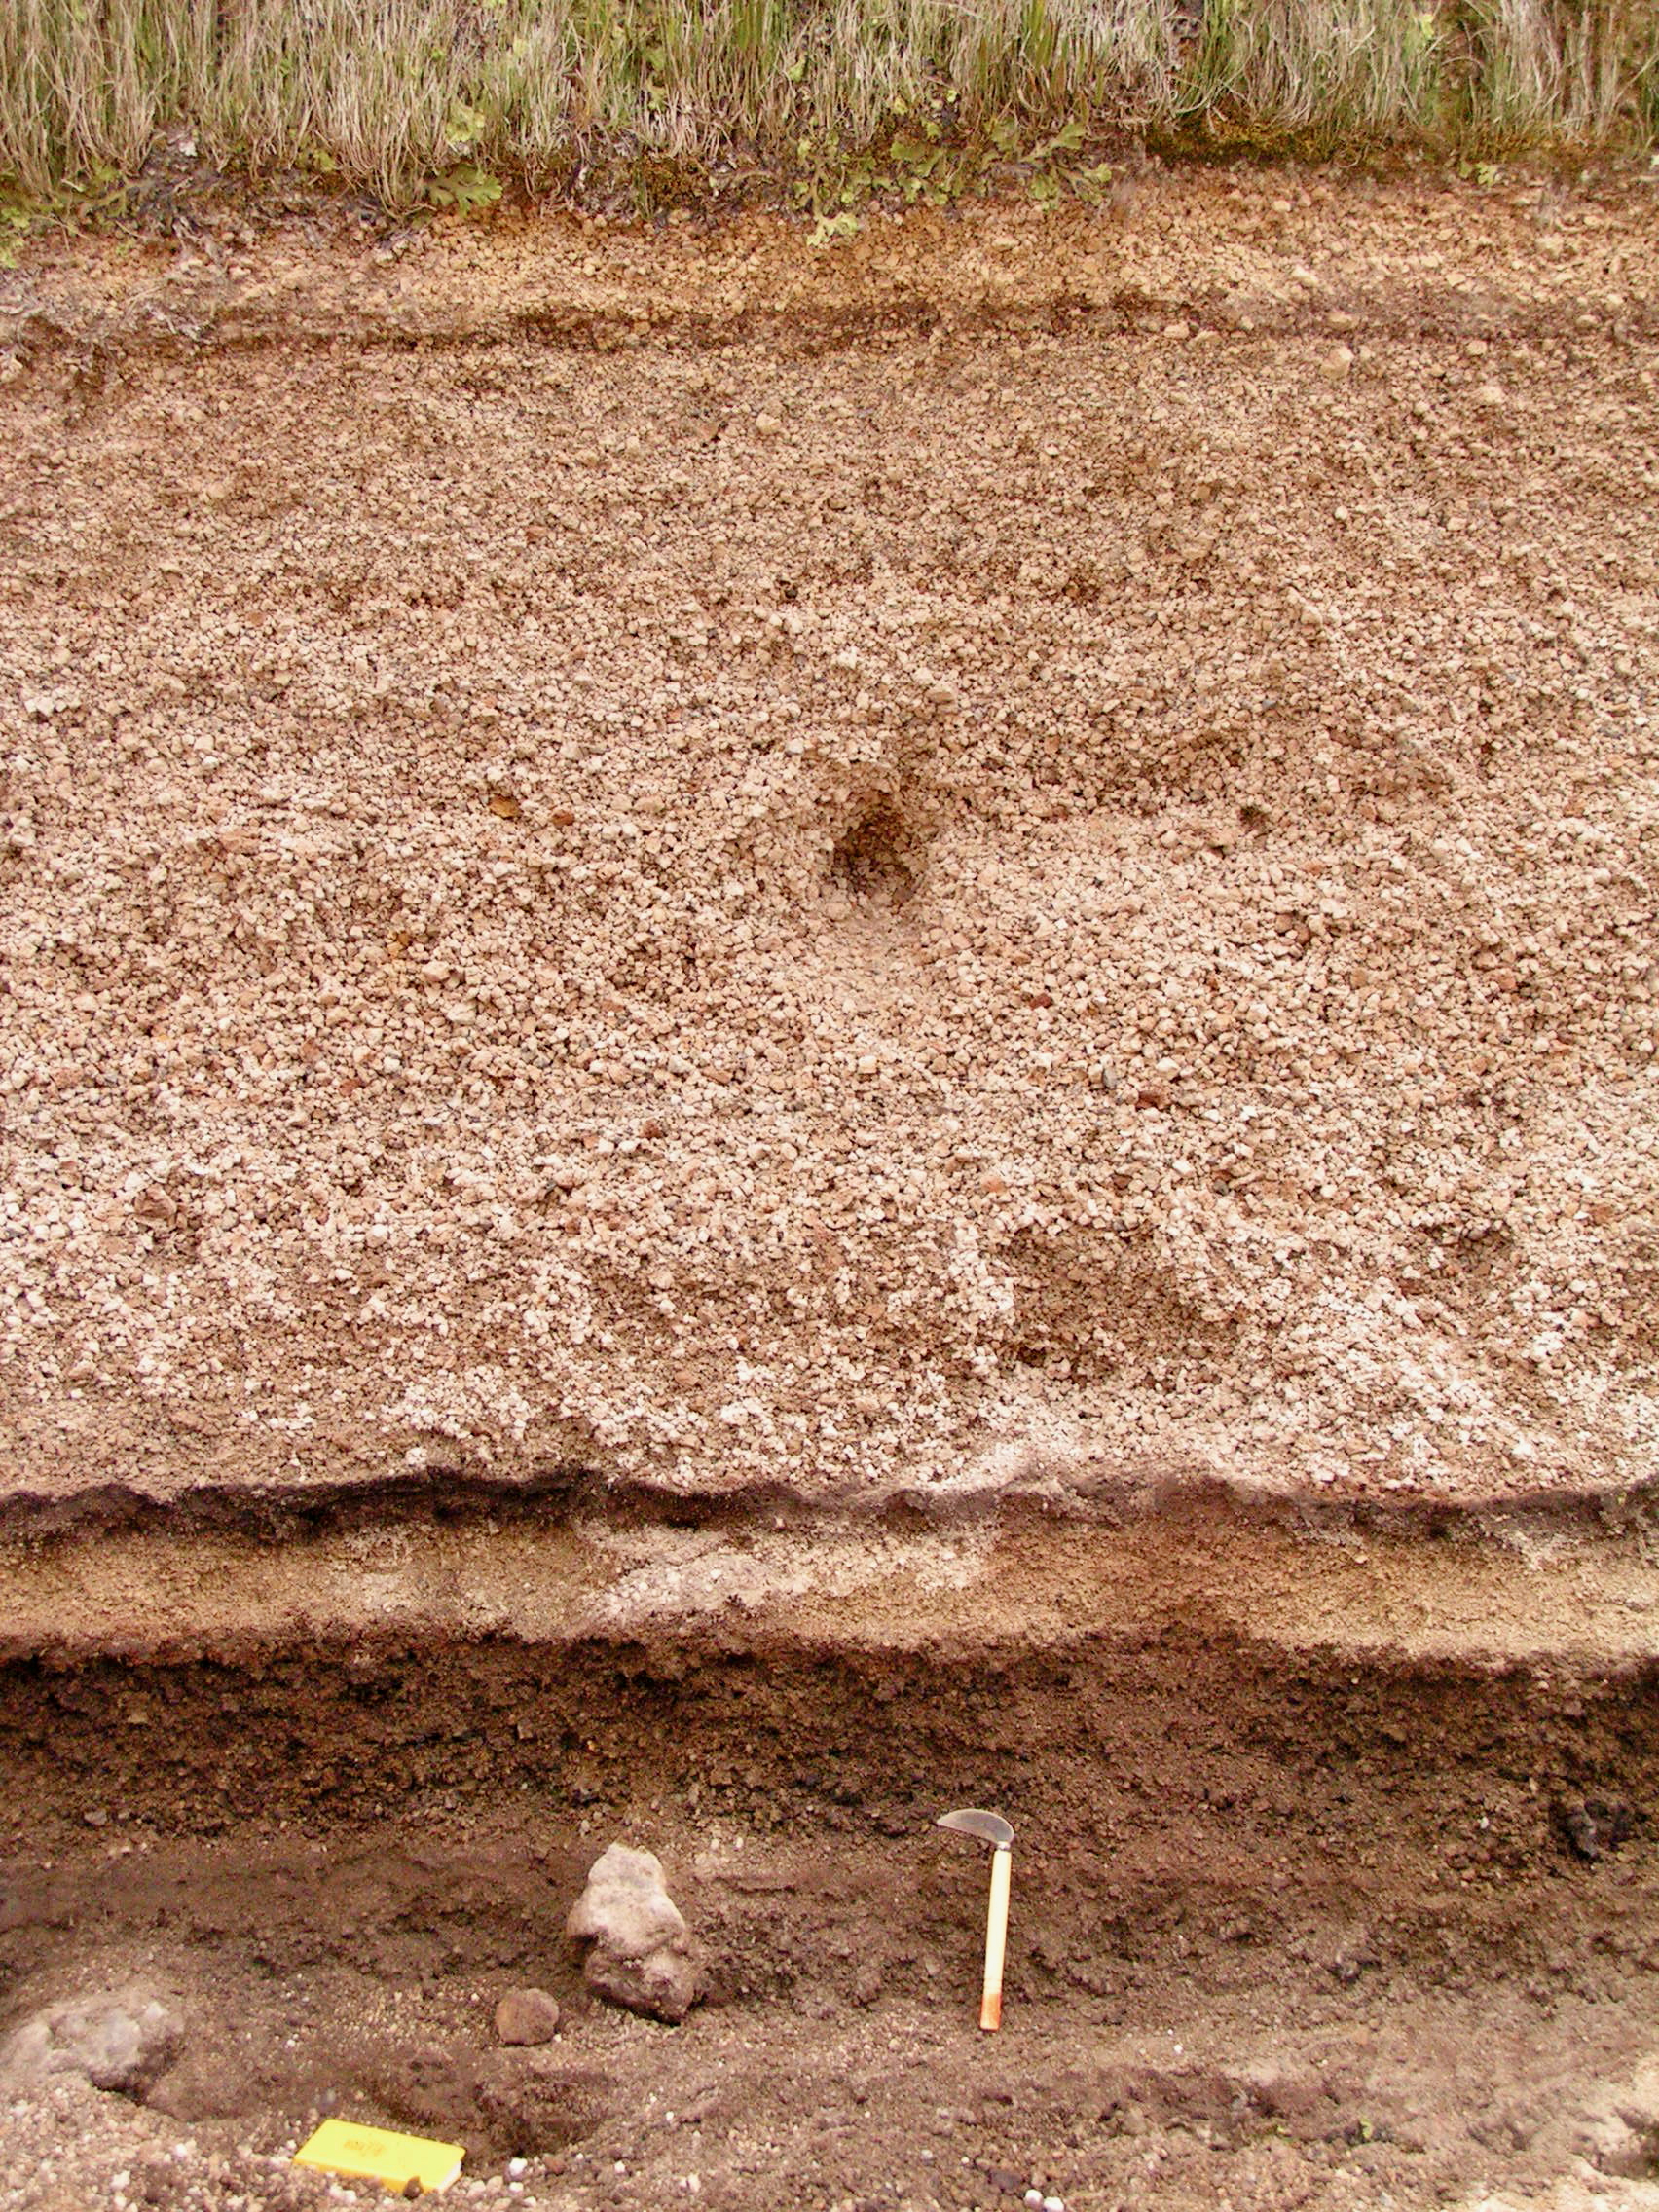
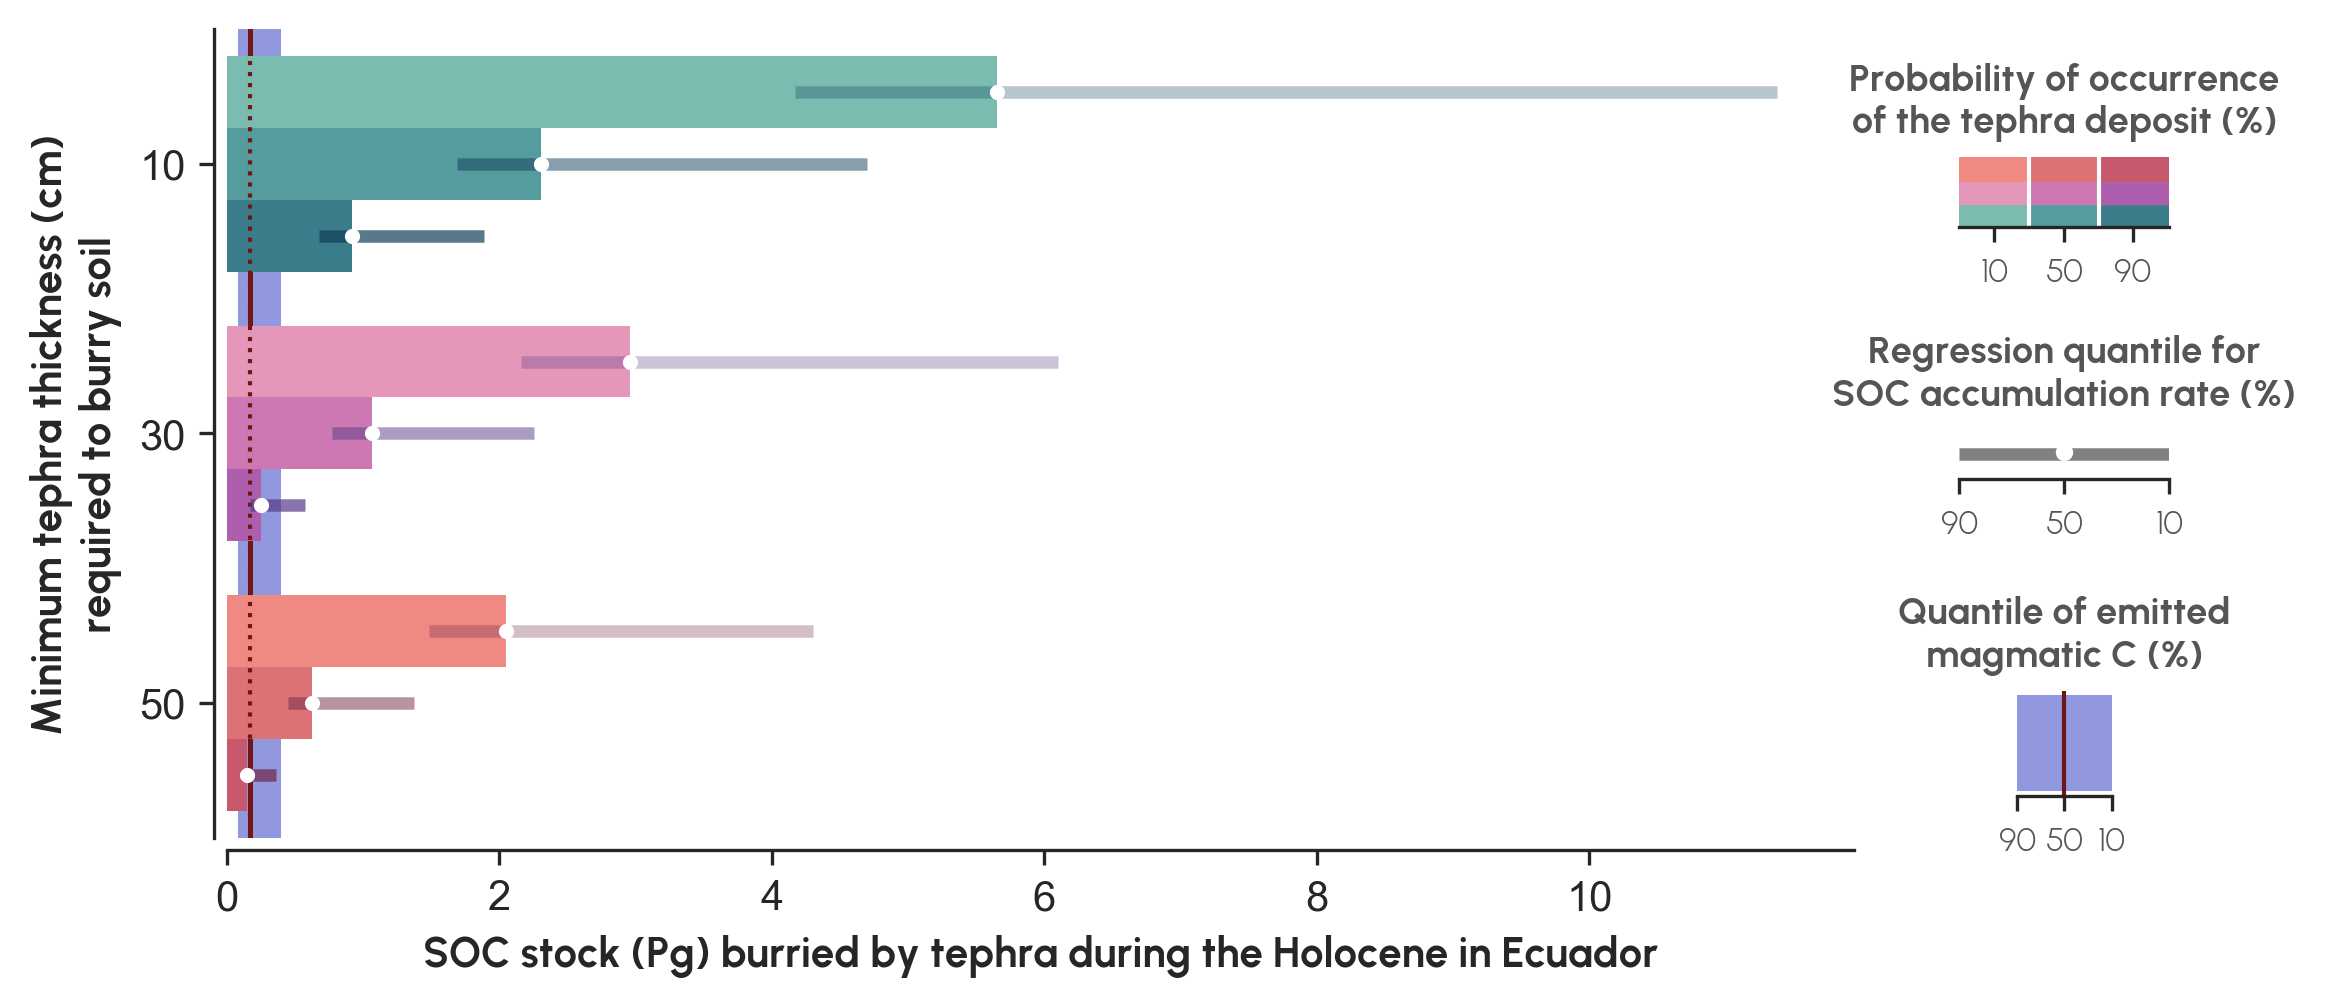
Example 1: In volcanically-active regions, soil burial after explosive eruptions capture more carbon that they emit.

Motivations

Motivation 3: Visualisation

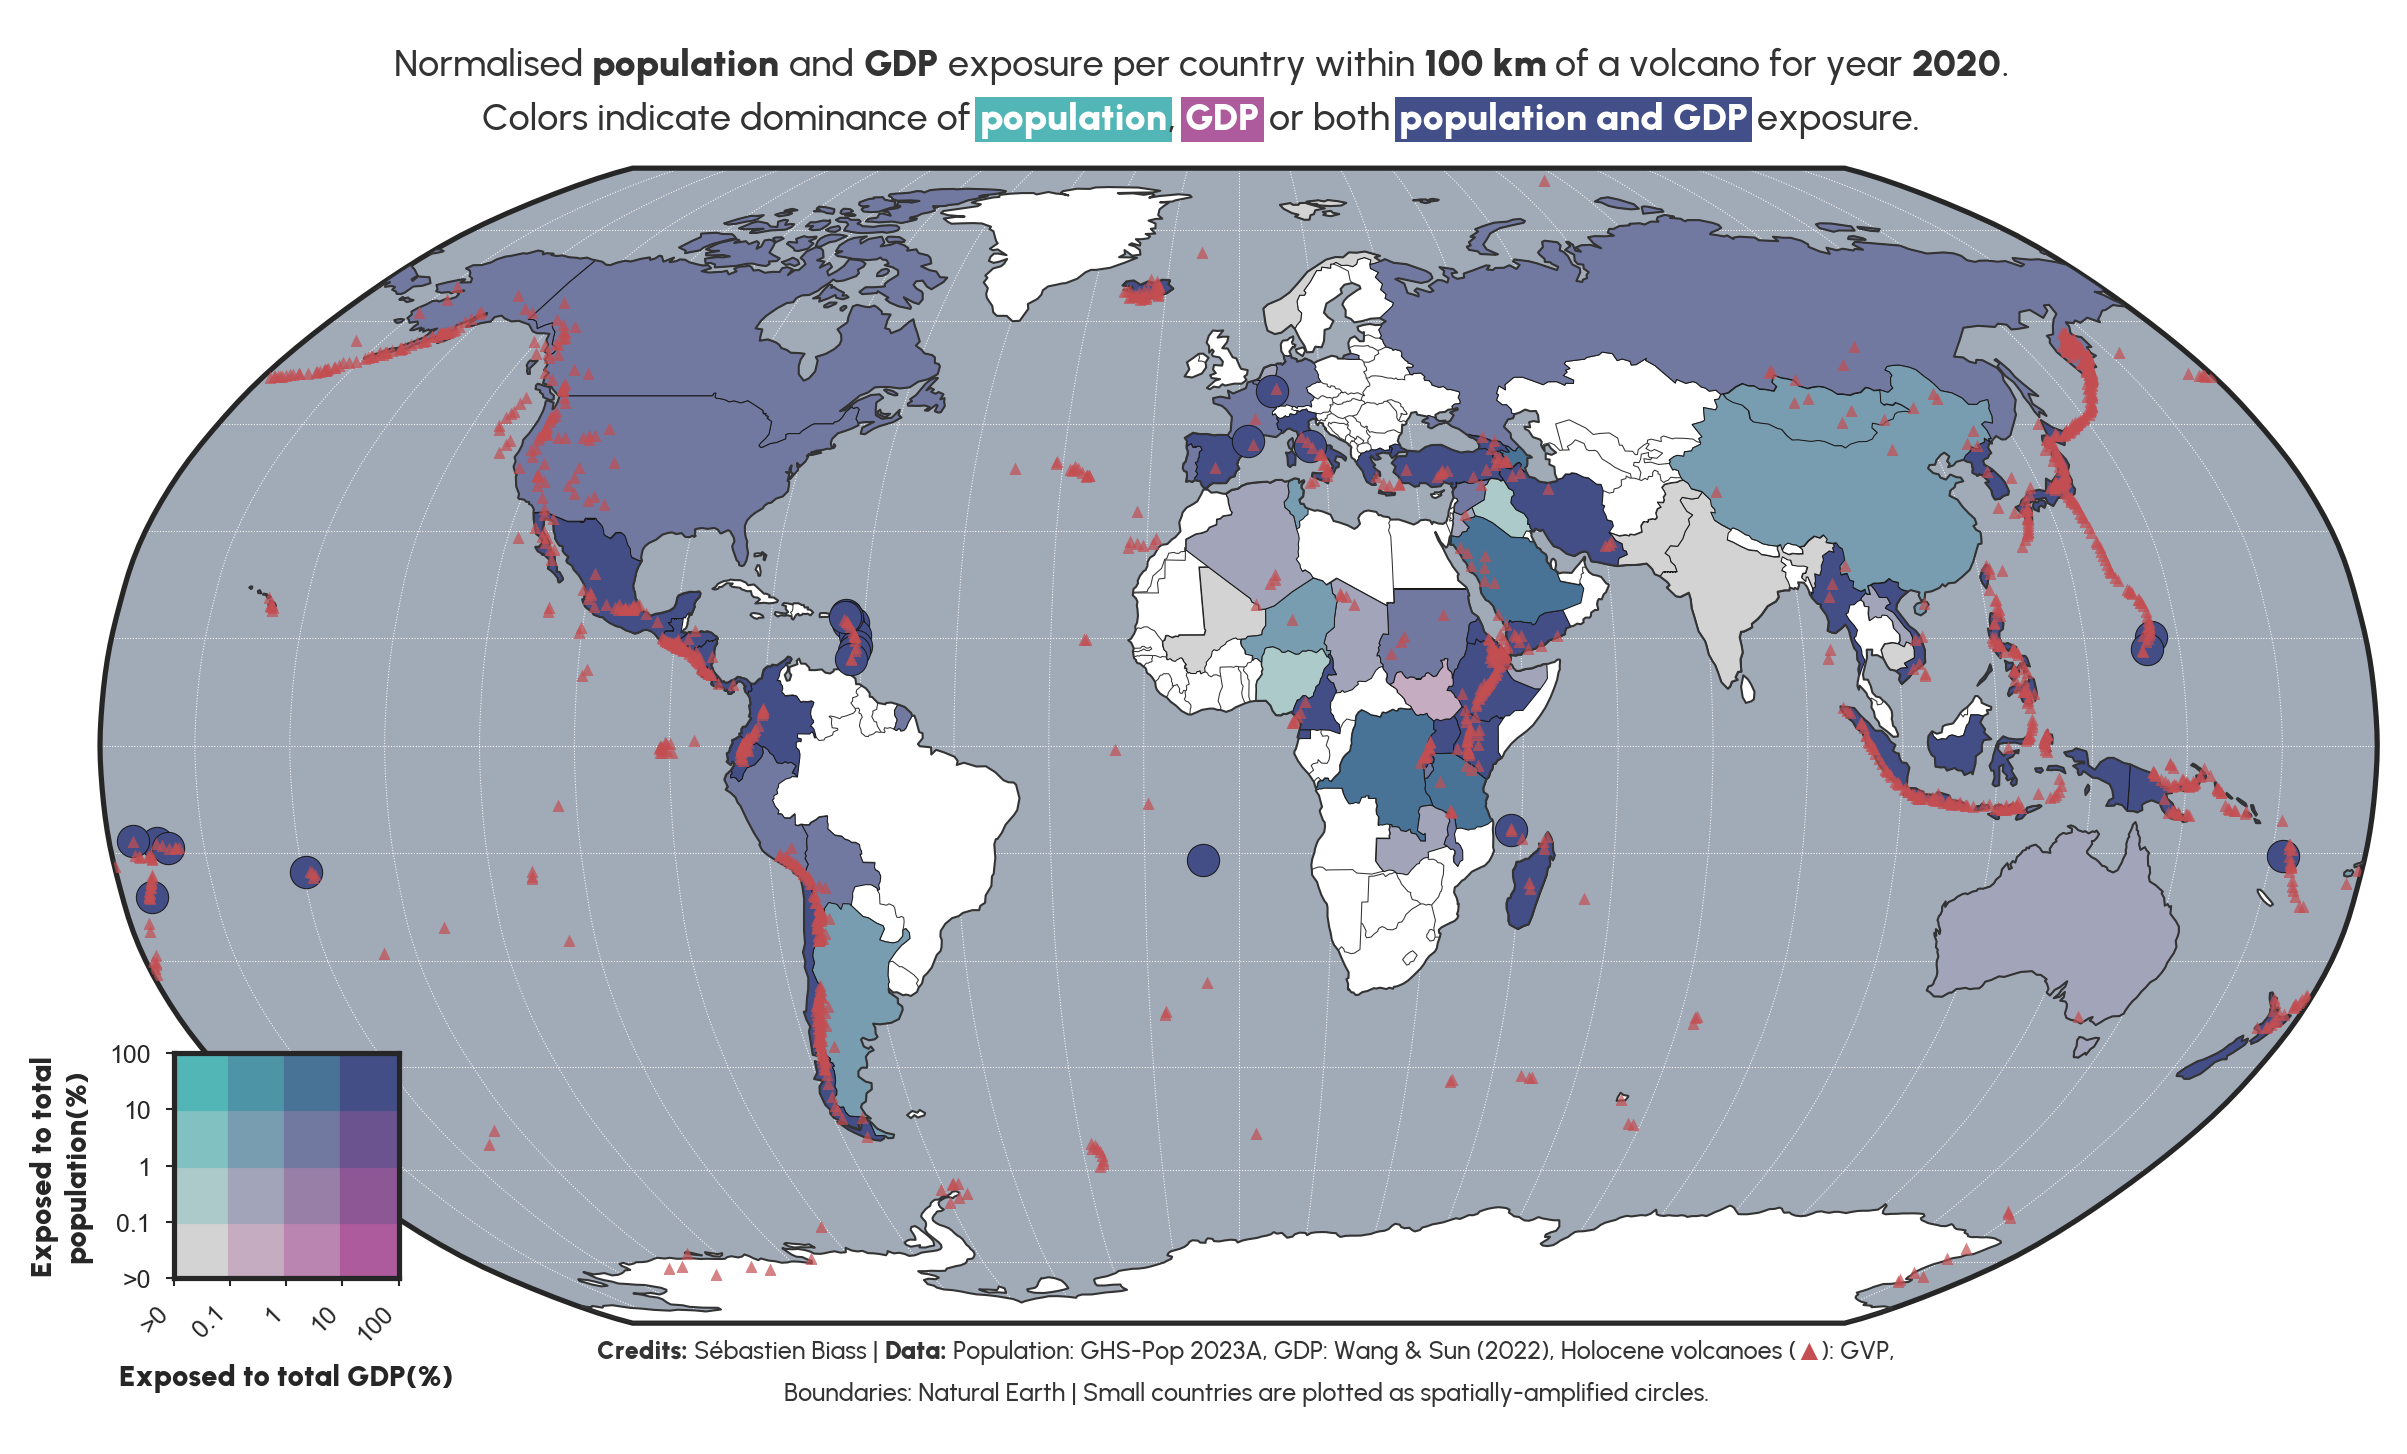
Example 2: In Small Island States, ≥90% of population and GDP is exposed to volcanic hazards.

Why Python?

Python’s advantages 1

  1. Free
  2. Open source
    • Not dependent on any company
    • Large online community
  3. Old → stable (started in 1991)
  4. Very popular in science
  5. Relatively easy to learn

What is Python

High-level computing language

  • Compiled → doesn’t directly speak to the computer, but is interpreted by another language
    • Usually slower, but much, much easier to use!

Modular

  • Python is composed of a core of functions complemented by wide ecosystem of specialized packages for specific tasks
    • A function is a bit of code to perform a specific task
    • A module is a collection of functions
    • A package is composed by multiple modules

An example of packages, modules and functions

In the code below, we first load the necessary packages and libraries:

  • matplotlib is the main visualisation package used in Python
  • pyplot is a module of matplotlib that provides easy-to-use functions for plotting data
  • figure is a function of pyplot and is the main function to prepare a plot
# Import the packages and modules
from matplotlib import pyplot as plt 
# Set up a figure for plotting
plt.figure(...) 

How to use Python

Option 1: Your own computer

  • Requires some setup
  • No internet connection required
  • Slow if computer is slow
  • All data stored on your own computer

Environment manager!

Make sure to install an environment manager → e.g. Miniconda

Option 2: In the cloud → Google Collab

  • No setup required
  • No internet connection required
  • Decent speed, free as long as Google says it is free
  • All data stored in the cloud

How to run Python

3 main ways to run Python…

  1. Run Python .py scripts from the command line → deprecated
  2. Run blocks of code from within a Python .py script using ipykernelsimilar behaviour to R/Matlab = ❤️
  3. Use Jupyter Notebooks in .ipynb files

…in two different environments

  1. Dedicated software: VSCode, PyCharm, Spyder
  2. Web browser: JupyterLab

Start coding!